

SCIENCE
STRATEGY
STORYTELLING
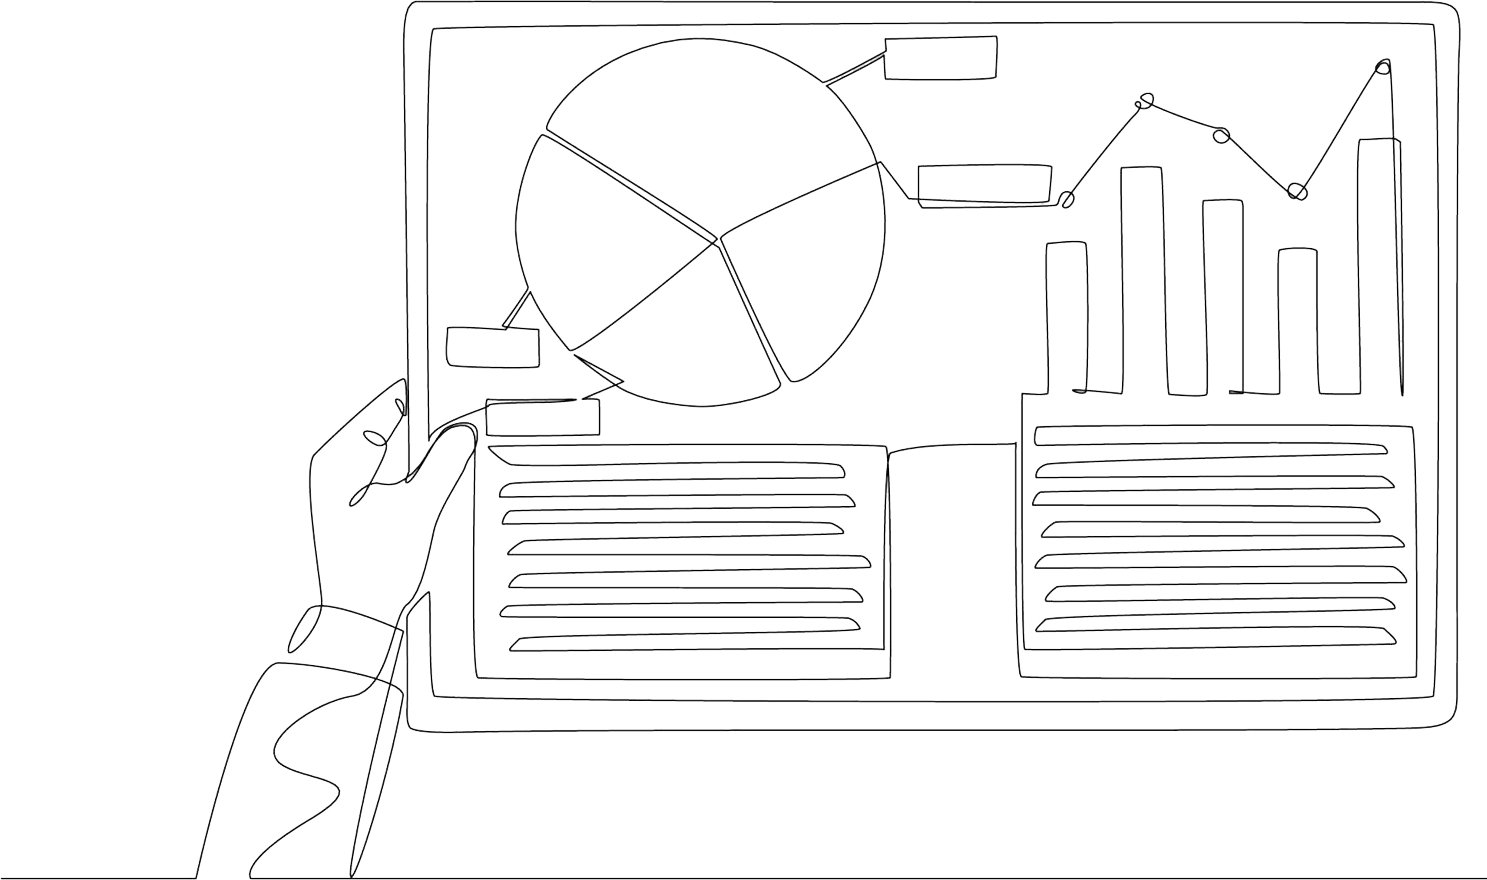
Impactful communications and marketing start and end with data.
But data is only useful in its ability to be understood, interesting, and be applied to real world problems. That's why we take a human approach to research and analytics. Our learnings are rooted in data science and brought to life with narrative based storytelling.

WHAT WE DO
THOUGHT LEADERSHIP
CORPORATE REPUTATION
GO TO MARKET STRATEGY
COMMUNICATIONS MEASUREMENT
BRAND EQUITY
MESSAGE + CREATIVE TESTING
PUBLICITY POLLING


WHO WE ARE
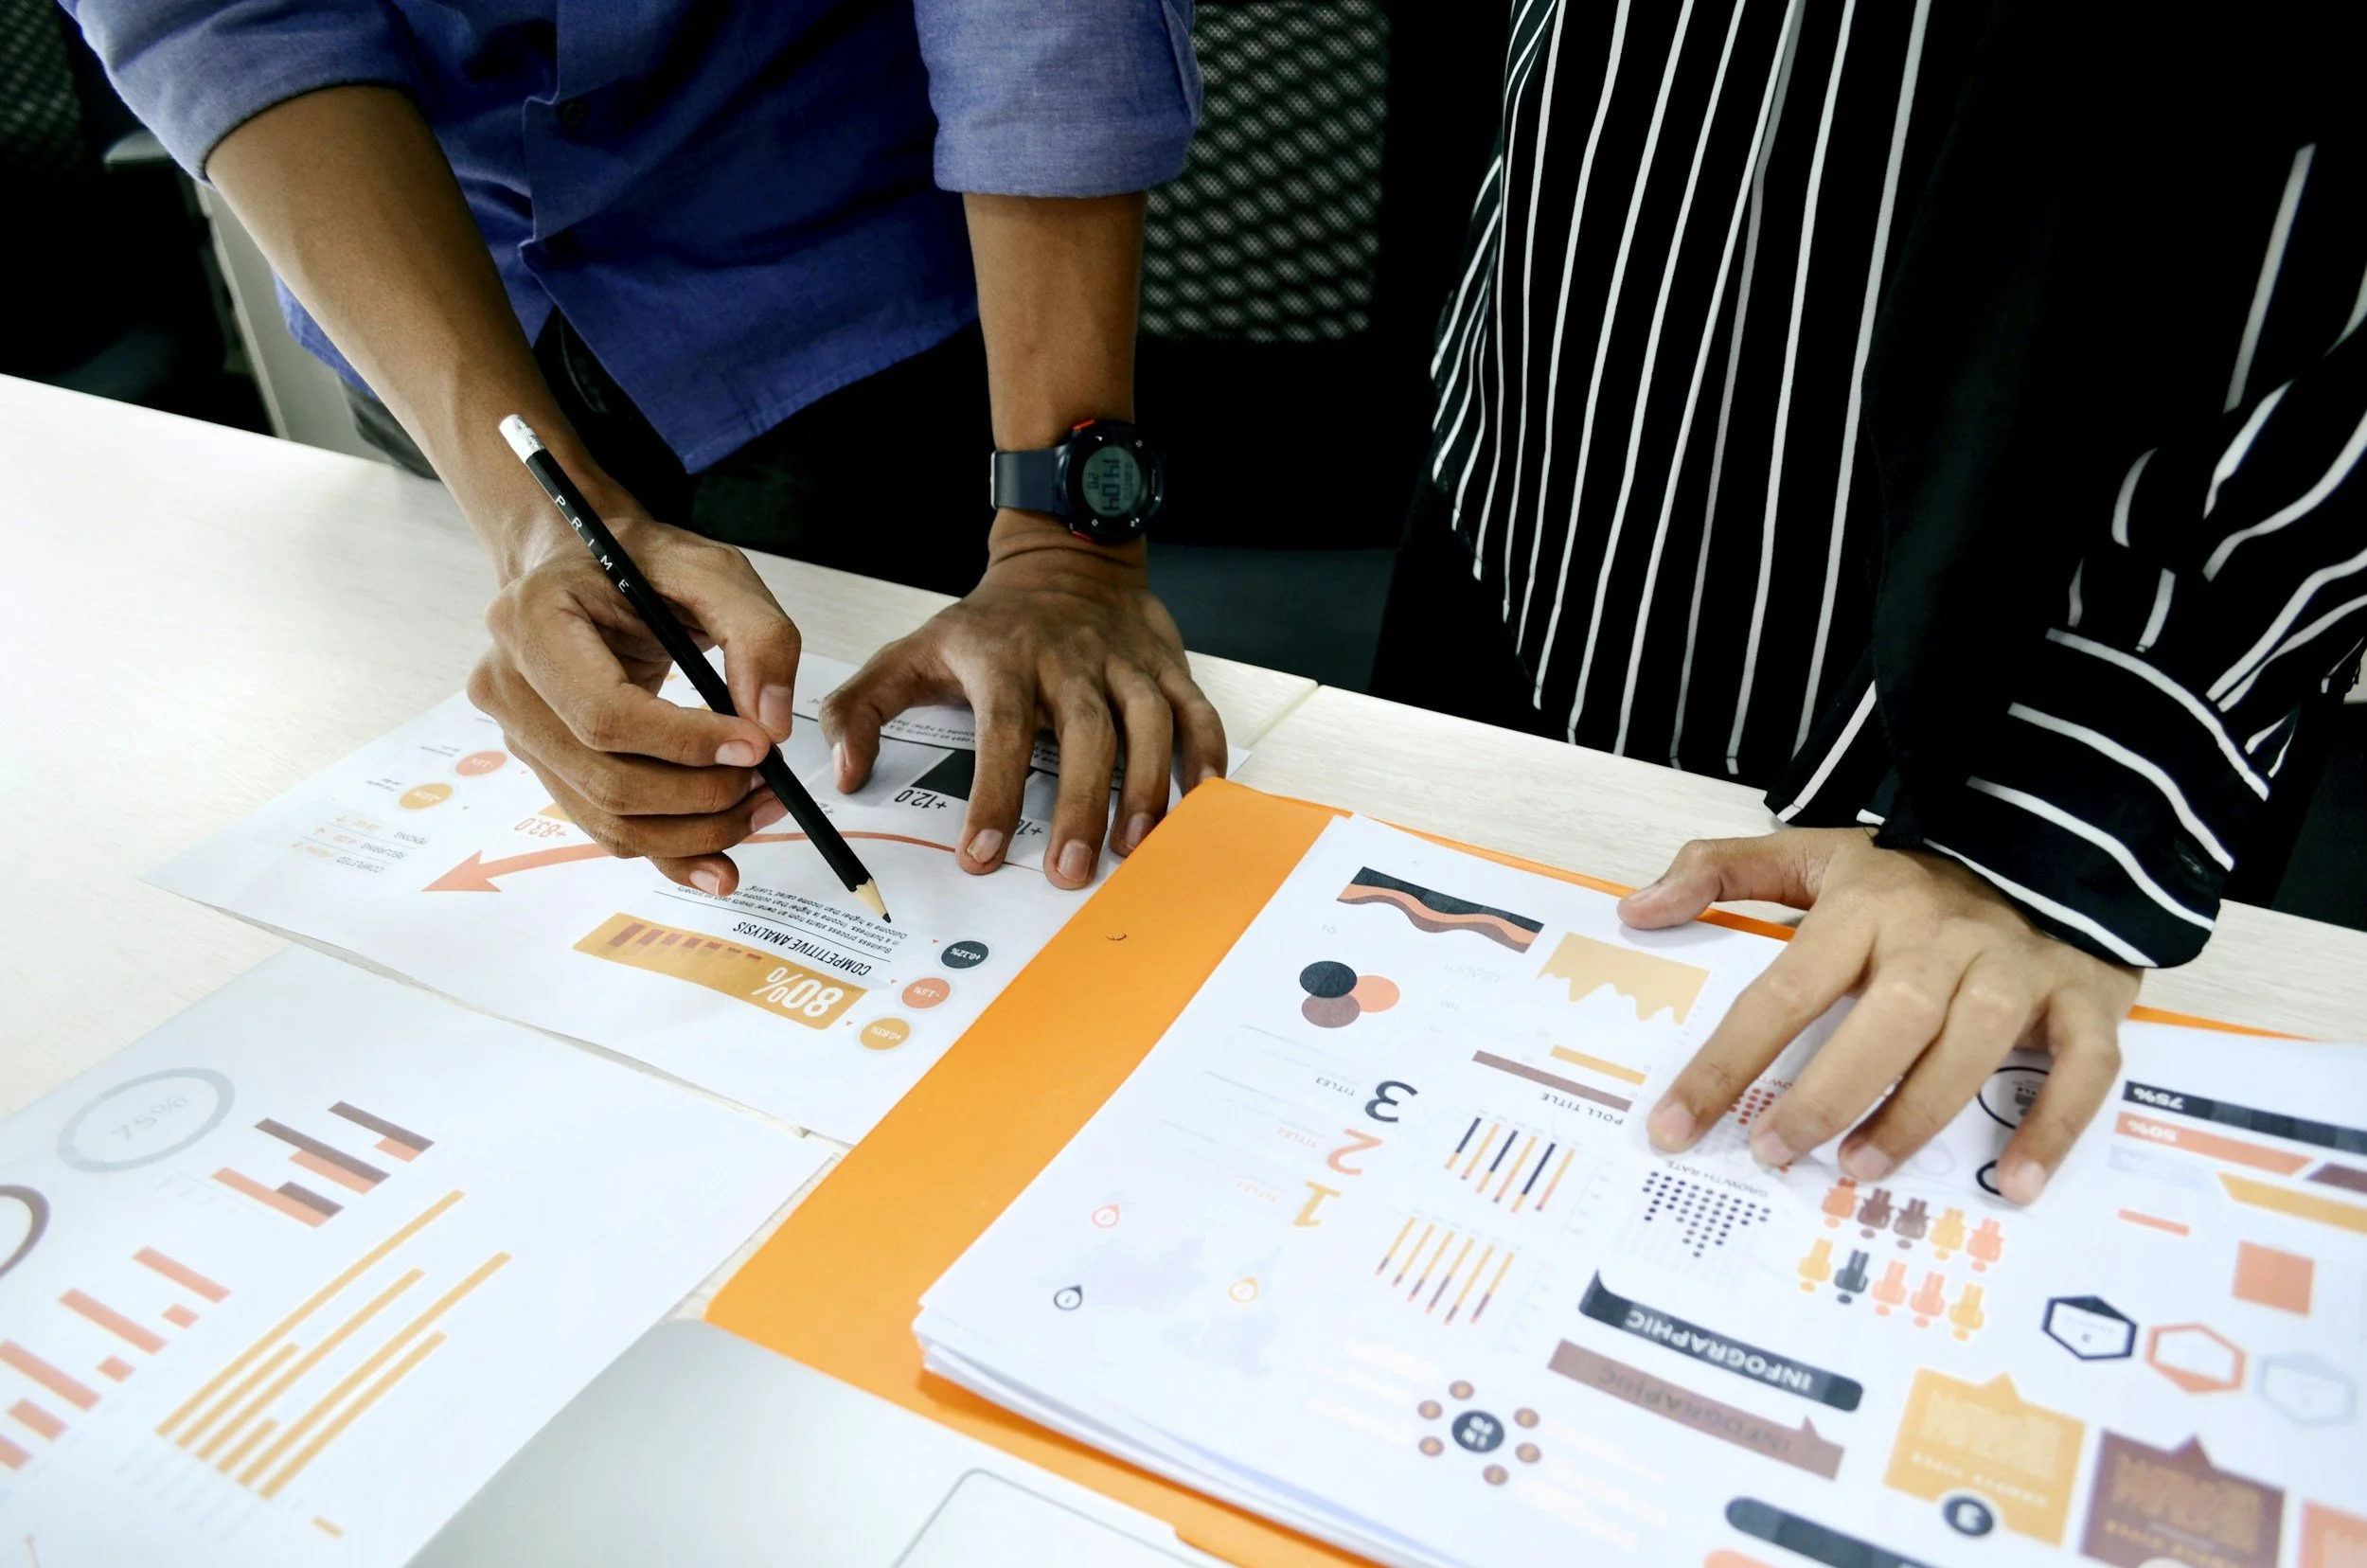
We're a boutique research consultancy that combines the precision of quantitative data with the nuance of qualitative insight.
Our approach is rooted in behavioral science and shaped by a practical understanding of how people think, feel, and make decisions. Whether you’re developing a campaign, refining a brand, or evaluating impact, we help you go beyond surface-level reactions to uncover the emotional signals and cognitive patterns that influence real-world behavior. Our work turns insight into strategy, so you’re not just communicating, you’re connecting.

OUR PARTNERS
We’ve teamed up with some of the world’s biggest brands and boldest newcomers across tech, financial services, consumer goods and more. The company we keep says a lot about who we are: curious, collaborative, and always up for a challenge.